


MPAndroidChart Example App

Descripción de MPAndroidChart Example App
This is the example / showcase application for the MPAndroidChart chart library / graph library on GitHub: https://github.com/PhilJay/MPAndroidChart
The library this app showcases (MPAndroidChart) is designed to create beautiful visual representations.
The core features of the library include:
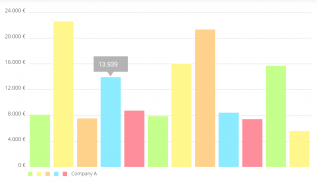
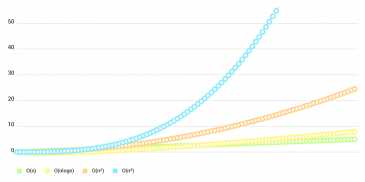
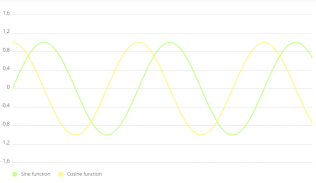
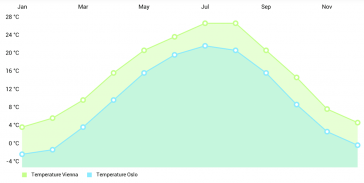
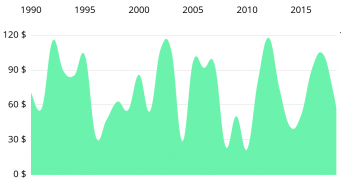
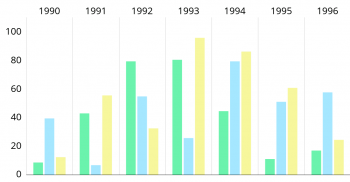
- Many different chart types: LineChart, BarChart (vertical, horizontal, stacked, grouped), PieChart, ScatterChart, CandleStickChart (for financial data), RadarChart (spider web chart), BubbleChart
- Combined Charts (e.g. lines and bars in one)
- Scaling on both axes (with touch-gesture, axes separately or pinch-zoom)
- Dragging / Panning (with touch-gesture)
- Separate (dual) y-axes
- Highlighting values (with customizeable popup-views)
- Save chart to SD-Card (as image)
- Predefined color templates
- Legends (generated automatically, customizeable)
- Customizeable Axes (both x- and y-axis)
- Animations (build up animations, on both x- and y-axis)
- Limit lines (providing additional information, maximums, ...)
- Listeners for touch, gesture & selection callbacks
- Fully customizeable (paints, typefaces, legends, colors, background, dashed lines, ...)
- Realm.io mobile database support via MPAndroidChart-Realm library
- Smooth rendering for up to 10.000 data points in Line- and BarChart (tested on a 2014 OnePlus One running Android 6.0)
- Lightweight (method count ~1.4K)
- Available as gradle dependency and via maven
- Widely used, great support on both GitHub and stackoverflow - mpandroidchart
- Also available for iOS: Charts (API works the same way)
- Also available for Xamarin: MPAndroidChart.Xamarin
This project is meant to demonstrate the features of the library and motivate developers to make use of it. This is not an app to create charts.
Esta es la aplicación de ejemplo / presentación para la biblioteca de gráficos / biblioteca de gráficos MPAndroidChart en GitHub: https://github.com/PhilJay/MPAndroidChart
La biblioteca que muestra esta aplicación (MPAndroidChart) está diseñada para crear hermosas representaciones visuales.
Las características principales de la biblioteca incluyen:
- Muchos tipos de gráficos diferentes: LineChart, BarChart (vertical, horizontal, apilado, agrupado), PieChart, ScatterChart, CandleStickChart (para datos financieros), RadarChart (spider web chart), BubbleChart
- Gráficos combinados (por ejemplo, líneas y barras en una)
- Escala en ambos ejes (con toque-gesto, ejes por separado o pizca-zoom)
- Arrastrando / Paneo (con toque-gesto)
- Ejes Y separados (duales)
- Destacar valores (con vistas emergentes personalizables)
- Guardar gráfico en tarjeta SD (como imagen)
- Plantillas de color predefinidas.
- Leyendas (generadas automáticamente, personalizables)
- Ejes personalizables (eje xy eje y)
- Animaciones (crear animaciones, tanto en el eje x como en el eje y)
- Líneas de límite (proporcionando información adicional, máximos, ...)
- Listeners para callbacks de gestos, gestos y selección.
- Totalmente personalizable (pinturas, tipografías, leyendas, colores, fondo, líneas discontinuas, ...)
- Soporte de base de datos móvil Realm.io a través de la biblioteca MPAndroidChart-Realm
- Representación suave de hasta 10.000 puntos de datos en Line- y BarChart (probado en un OnePlus One 2014 con Android 6.0)
- Ligero (método contado ~ 1.4K)
- Disponible como dependiente de gradle y via maven.
- Ampliamente utilizado, gran soporte tanto en GitHub como en stackoverflow - mpandroidchart
- También disponible para iOS: Gráficos (API funciona de la misma manera)
- También disponible para Xamarin: MPAndroidChart.Xamarin
El objetivo de este proyecto es demostrar las características de la biblioteca y motivar a los desarrolladores a utilizarla. Esta no es una aplicación para crear gráficos.


